
Required Prior Reading: To make the most out of this article you should read these
So you just did a A/B test between the old version A and a proposed new version B. Your results from 200 observations show version A received 90 and version B received 110. Data analysis says there is no statistically significant difference between the two versions. But you were convinced that version B is better (because of its UI design and your prior knowledge etc.). So should you give up and not roll out version B? [tweetmeme source=”pricingright”]
With A/B testing, it is not enough to find that in your limited sampling, Version B performed better than Version A. The difference between the two has to be statistically significant at a preset confidence level . (See Hypothesis testing.)
It is not all for naught if you do not find statistically significant difference between your Version-A and Version-B. You can still move your analysis forward with some help from this 19th century pastor from England – Thomas Bayes.
Note: What follows below is a bit heavy on use of conditional probabilities. But if you hung in there, it is well worth it so you do not throw away a profitable version! You could move from being 60% certain to 90% certain that version B is the way to go!
Before I get to that let us start with statistics that form the basis of A/B test.
With A/B testing you are using Chi-square test to see if the observed frequency difference between the two versions are statistically significant. A more detailed and an easy to read explanation can be found here. You are in fact starting with two hypotheses:
The Null hypothesis H0: The difference between the versions are just random
Alternative hypothesis H1: The difference is significant such that one version performs better than the other.
You also choose (arbitrarily) a confidence level or p-value at which you want the results to be significant. The most common is 95% level or p=0.05. Based on your computed Chi-square value for that p value (lesser than corresponding value for 1 degree of freedom or greater ) you retain H0 or reject H0 and accept H1.
A/B test results are inconclusive. Now What?
Let us return to the original problem we started with. Your analysis does not have to end just because of this result, you can move it forward by incorporating your prior knowledge and with help from Thomas Bayes. Bayes theorem lets you find  the likelihood your hypothesis will be true in the future given the observed data.
Suppose you were 6o% confident that version B will perform better. To repeat, we are not saying Version B will get 60%, we are stating that your prior knowledge says you are 60% certain version B should perform better (i.e., the difference is statistically significant). That represents your prior.
Then with your previously computed Chi-square value, instead of testing whether or not it is significant at p value 0.05, find for what p value the Chi-square value is significant and compute 1-p (Smith and Fletcher).
In the example I used, p is 0.15 and 1-p is 0.85. According to Bayes, this is the likelihood that data fit the hypothesis given the hypothesis.
Then the likelihood your hypothesis will be correct in the future (posterior) is 90%
(.60 * .85)/(.40*.85+.3*.15)
From being 60% certain that version B is better you have moved to being 90% certain that version B is the way to go. You can now decide to go with version B despite inconclusive A/B test.
If the use of prior “60% certain that the difference is statistically significant” sounds like subjective, it is. That is why we are not stopping there and improving it with testing. It would help you to read my other article on hypothesis testing to understand that there is subjective information in both classical and Bayesian statistics. While with AB test we treat the probability of hypothesis ( that we set as) 1, in Bayesian we assign it a probability.
For the analytically inclined, here are the details behind this.
With your A/B testing you are assuming the hypothesis as given and finding the probability the data fits the hypothesis. That is conditional probability.
If P(B) is the probability that version B performs better then P(B|H) is the conditional probability that B occurs given H. With Bayesian statistics you do not do hypothesis testing. You are find the conditional probability that given the data which hypothesis makes sense. In this case it is P(H|B). This is what you are interested in to decide whether to go with version B or not
Bayes theorem says
P(H|B) = (Likelihood * Prior )/ P(B)
Likelihood = P(B|H) what we computed as 1 -p (See Smith and Fltecher)
Prior = P(H) – your prior knowledge, the 60% certain we used
P(B) = P(B|H)*P(H)+ P(B|H-))*(1-P(H))
P(B|H-) is the probability of B given hypothesis is false. In this model it is p since we are using P(B|H) = 1-p
This is a hybrid approach, using classical statistics (the p value you found the A/B test to be significant) and Bayesian statistics. This is a simplified version than just Bayesian statistics which is computationally intensive and too much for the task at hand for you.
The net is you are taking the A/B test a step forward despite its inconclusive results and are able to choose the version that is more likely to succeed.
What is that information worth to you?
References and Case Studies:
- Bayesian hypothesis testing for psychologists: A tutorial on the Savage–Dickey method. By: Wagenmakers, Eric-Jan; Lodewyckx, Tom; Kuriyal, Himanshu; Grasman, Raoul. Cognitive Psychology, May2010, Vol. 60 Issue 3, p158-189
- The Art & Science of Interpreting Market Research Evidence – Hardcover (May 5, 2004) by D. V. L. Smith and J. H. Fletcher
- Lilford R. (2003) Reconciling the quantitative and qualitative traditions: the Bayesian approach . Public Money and Management vol 23, 5, pp 2730284
- Retzer J (2006) The century of Bayes. I J of Market Research vol 48, issue 1, pp 49-59

(continuing the thread from above, but for some reason I can’t “reply” to your latest).
First, I agree completely about “seeking,” in fact I wrote a post about that logical fallacy too: http://blog.asmartbear.com/pattern-seeking-fallacy.html
However that’s nothing to do with what we’re discussing.
The question here is: Is this a correct application of Bayesian inference, and I still do not believe that it is.
Responding to your most recent comment, here I think is the root of the problem: You’re allowing “gut feel” to be a valid “prior,” but that’s simply not correct.
Priors are typically base-rates of known correlations, not numbers you’re allowed to make up based on “gut” which you “refine.”
Typical examples are when you’re trying to figure the probability that a patent has a disease D. The incidence of the disease in the general population is p(D), so that’s your prior — not based on gut, but based on data.
But then there’s symptoms. Half the time, diseased people have symptom S1, so p(S1|D) = 0.5 (read: probability of S1 given that you have the disease). A tenth the time, diseased people have symptom S2: p(S2|D) = 0.1.
But ALSO there’s base rates — again NOT gut checks but actual data. That’s the probability that anyone in the population has S1 or S2, p(S1), p(S2). So if S1 is “coughing,” the population at large might have 8% of people coughing, so p(S1) = 0.08. Maybe S2 is “tiredness,” and the population at large might be 10% tired.
What Baysian inference lets you do is improve your guess by computing p(D|S1) and even p(D|S1&S2), that is the probability that you have the disease given that you have these symptoms. The amount this increases your knowledge is due BOTH to the rarity of the symptom in general (because e.g. if 90% of the population has the symptom, if you have it too, it doesn’t really imply you have the disease!) and to the amount of the time that symptom comes with the disease.
In your example, you’re inventing all the base rates. It’s whatever your “gut” says it is.
Which is completely not what this inference is about.
And, I will add, it’s ESPECIALLY invalid because we KNOW that with A/B testing our “guts” — even with experienced marketers — are often wrong, therefore it’s even less interesting to “modify” an opinion we know is unlikely to be valid.
Finally, to address your point about “state your opinion about H1,” — *everyone* will have a greater-than-zero probaility of thinking it’s true, otherwise you WOULDN’T TEST IT! Therefore, in your method, EVERY test is biased in favor of being significant.
That’s another signal that this isn’t statistics, it’s just a permanent bias towards being significant, and the only question is “how much bias,” and the answer is, “whatever your gut says it should be.”
LikeLike
Jason
Thanks for taking the time to write detailed comment. First, I really loved your article that shows the Chi-square math and I guess I have not seen another person recommending Chi-square over t-test. I did a spreadsheet for Avinash Kaushik’s blog and I show both t-test math and Chi-square math.
The basis is using Bayesian stat – using prior knowledge and then collecting more data to refine the prior. This prior estimate can come from many sources – prior knowledge or it can indeed be based on gut feel (gasp). I see that I am making a statement that combines measure of uncertainty in the same statement. With Bayesian we can refine this gut-feel, or completely toss it as we collect new data. Bayesian helps us bring together analytics and prior knowledge to make better decisions.
While I rely on hypothesis testing for all my analytics works (including regression analysis) the problem is we assume to be true the very hypothesis we are trying to prove.
Let us say, H1 is the alternate hypothesis that the difference are not just due to random.
We collect data and verify how likely does the data fit the hypothesis (i.e, not fit H0).
That is we calculate P(D|H1), where as we want P(H1|D), that is given the data how likely is H1 true. We can’t find that with hypothesis testing.
With the method I suggest I am asking folks to state P(H1). Yes an overly optimistic person will state a very high number. But if they are intellectually honest in seeking data (without experimental errors) the new data will help refine this. With this new data we measure P(D|H1) and P(D) and hence P(H1|D) which becomes the new P(H1).
I see bigger problems with prolific A/B testing of every possible combination without applying prior knowledge. When we run so many different tests with extremely large samples we are bound to find statistical anomalies to be significant. A recent xkcd comic very nicely illustrates this idea. With Bayes, we are asked to make better hypothesis based on prior knowledge and keep refining it.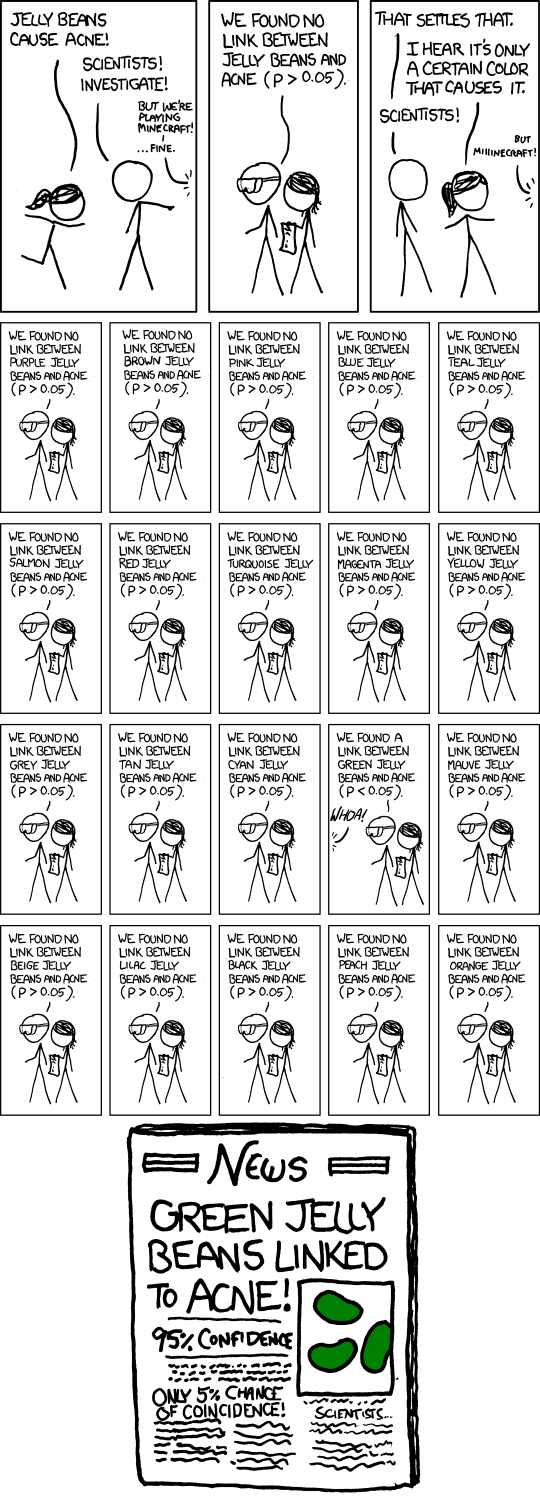
Best regards
-Rags
LikeLike
Thank you for referencing my article, but I’m afraid I have to respectfully agree with paras.
This is an incorrect application of conditional probability. The idea of conditional is not that “I’m 60% sure.”
To see why, consider that one of the lessons of A/B testing is that we’re all bad at predictin what will work better. Almost every case study has surprises. One conclusion is that being at all sure of the results is folly.
But here’s the real rub:
Removing te human from the equation for a minute, the data indicate a rejection of H0 at some confidence level. Of course you can decide ahead of time what level is acceptable to your risk tolerance for action a false positive.
Now adding the human back in, depending on what the human “thinks” is happening, whether for or against H1, and “how sure.” you can quite literally produce any outcome. That is, the opinion of the human simply dictates the result in all but the most extreme cases.
Put another way, in the example you give, ou have a truly inconclusive result, yet you allow a human opinion to make it conclusive.
Clearly, then, you’re not describing a dispassionate statistic.
You’re incorrect to equate this with choosing a confidence level, because that is simply stating a preference for how willing you are to accept a false/positive result. Yes that’s “arbitrary,” but you’re defining a parameter.
When you state prior certainty that isn’t a preference, that’s made-up data — in an area where humans are known to be bad at guessing!
And Paras: there’s no need to be insulting while arguing.
LikeLike
Thanks for reading.
LikeLike
Ryan
There are very good articles on Chi square testing and how these are used in A/B testing. Please check these out
http://faculty.vassar.edu/lowry/csfit.html
http://faculty.vassar.edu/lowry/chi_beta.html
http://blog.asmartbear.com/easy-statistics-for-adwords-ab-testing-and-hamsters.html
On use of Bayesian or rather the hybrid approach – stay tuned.
-rags
LikeLike
oh, and given zyxo’s comment, maybe you could do a Scenario #1, and a Scenario #2, with 1 being the traditional stats version (what we would try in this case, but find lacking due to it’s black/white methodology and results, albeit with more conclusive certainty, i suppose).
and #2 being the way to approach the same problem / scenario / need with the bayseian method, presumably so we have something to work with or improve the outcome / data / confidence.
r
LikeLike
rags, i appreciate the post. it’s ringing bells in the deep recesses of my brain from the 1 semester i spent in a grad level quantitative methods class. i wasn’t too atuned to the info in that class, so i’m struggling here.
could you run through another (well, first) concrete example? make up the scenario, the purpose/reason/need for the test, the data starting out, and then the thoughts per step of the Chi-Square…? is that feasible?
i feel like i almost connected the dots here. just would love a little extra push.
i remember “chi-square” as a test type, along with anova (? i think that was it), but i’m pretty sure we discussed it theoretically, then had a computer do the calculations.
would love to apply this to paid search, site optimization, etc…
thanks!
r
LikeLike
Excellent. Thank you very much.
Concerning the concept of significance, here is another good post written (in French…) by Alan Boydell. You should find there a quite convenient “Significance Tester” that can be downloaded.
http://www.web-analytics.fr/statistiques-guinness-et-web-analytics/
B.
LikeLike
Zyxo – white it is true that in one tailed tests we are testing higher or lower that is not the same as prior as used in Bayesian. The point to note is that in classical stats we assume that the hypothesis is true and test whether the data fits the hypothesis. In Bayesian you are uncertain about the hypothesis and try to reduce this uncertainty with test.
LikeLike
@ Paras Chopra
Even in “conventional” statistics we see something like a prior : if we expect that B will be better, we use a one-tailed test. This also means that if it would turn out that A is a lot better, this would not be significant, because we test the hypothesis that B is better. The only thing we would conclude is that our hypothesis is false.
I am not familiar with bayesian statistics, but I suspect that the decision between two-tailed and one-tailed tests can be seen as some simplification of Baysian statistics.
LikeLike
Paras
Thanks for reading and participating.
Why do you say this is completely wrong? Are you dismissing the entire branch of Bayesian statistics or my application of it.
Just to be very clear the prior knowledge I refer to is not how good version B is going to be but to how confident the decision maker is about the difference. In other words, I do not say above that “version B will get 60%”. If I had that indeed would have no rationale.
The prior is the subjective call about your own confidence level. This can be an educated guess, hunch, prior experience with similar situations – it does not matter because it is a probability and is stated with uncertainty. In a more rigorous case the prior knowledge could be expressed as a probability distribution. As long as the decision maker realizes that this prior knowledge has uncertainty associated with it.
The next step is of course is improving this prior, the uncertainty in it, based on data using Bayes theorem.
If you are 100% confident that B will perform better then you still want to do the test to improve your prior knowledge.
Consider the A/B test itself, why choose 95% level? Why use Chi-square test at all? Why reject the hypothesis at 94% level? These are subjective levels.
By the way, when we say we retain H0 at 95% level we are really saying there is not much evidence in the data to overthrow H0 in more than 5% of possible samples from the population.
As you use the terms within quotes, “science” and “math”, the method I reported stands on solid ground of peer reviewed research.
Best regards
-rags
LikeLike
I’m sorry but your method is totally wrong. Your prior of “60%” has absolutely no rationale (other than your “gut feeling”). It could have very well been 100%, thus obviating the need for A/B testing in the first place. It looks like you want to retrofit the results based on what you wished the test to have yielded.
Sorry, but behind all the “science” and “math” you have done, your method is nothing better than not doing A/B test at all.
LikeLike